

Have euro area exports missed the tech train?
Prepared by Mattia Banin, Virginia Di Nino, Laura Lebastard, Noémie Lecourt and Stefan Schaefer
Euro area export market shares have declined since the pandemic. The share of euro area firms in global goods exports has fallen by about 2 percentage points since 2019.[1] The weakness of euro area export growth is a sign of lower productivity gains of European firms compared to other major economies. While there are a number of factors behind the euro area’s competitiveness challenges, the Draghi report pointed to Europe’s lack of competitiveness in high-tech sectors as one key factor in the euro area’s subdued economic performance.[2] This box assesses the sectoral composition of the euro area’s recent performance in global markets by categorising exports according to the intensity of their technological content, as reflected in the level of research and development expenditure relative to value added. This helps in identifying the sectoral drivers of the losses in market share. Specifically, the box examines whether aggregate euro area export market share losses reflect a limited presence in fast-growing high-tech sectors or a deteriorating performance in established sectors.
Understanding the role of the sectoral composition of export dynamics is important when analysing the impact of policy tools that have been deployed to boost production in particular sectors in recent years. Since 2019 both the United States and China have introduced new policies, including with a view to strengthening their export market dynamics in specific sectors. In the United States, the Inflation Reduction Act and the CHIPS and Science Act are aimed at increasing investment in high-tech sectors and onshoring production back to the United States. In China, government policies aimed at developing national champions employ a long-standing strategy of boosting technological advancement through substantial subsidies for high-tech industries.[3] These subsidies have resulted in overcapacities, enabling Chinese producers to adopt aggressive pricing strategies in foreign markets. This is aligned with China’s concept of “new productive forces”, which prioritises innovation and technological development as key drivers of economic growth, with a focus on sectors such as electric vehicles, microchip technology, artificial intelligence and new materials.[4] With authorities in other major economies using such tools to boost both investment and production in particular sectors, it is important to understand how sectoral dynamics are shaping the euro area’s overall export performance.
Eurostat divides manufacturing sectors into four categories according to the technological content of the goods produced. High-tech sectors include pharmaceuticals, telecommunications equipment and aerospace, while medium-high-tech sectors include motor vehicles, chemicals and electrical equipment.[5] Medium-high-tech represents the largest global export market (32% in 2024), well ahead of high-tech (18% in 2024) (Chart A). However, while medium-high-tech sectors have been shrinking since 2019, high-tech sectors have grown by 6 percentage points.
Chart A
Manufacturing exports by technology intensity
(percentages)
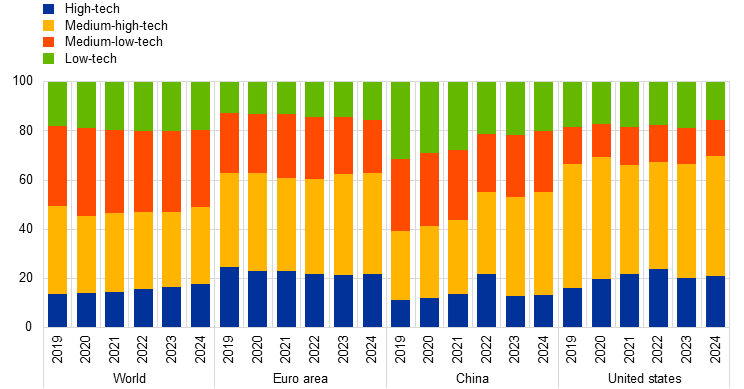
Sources: Trade Data Monitor (TDM), Eurostat and ECB staff calculations.
Notes: Exports are in nominal value. 2024 data are incomplete. The latest observations are for November 2024.
The technological composition of euro area, Chinese and US exports has converged in recent years. The sectoral composition of euro area exports has been relatively stable since 2019, with medium-high-tech sectors making up 41% of total manufacturing exports in 2024 (Chart A). In the same period, China’s medium-high-tech exports increased significantly from 28% to 42%. This shift indicates that China’s exports have moved up the value chain, making its export structure increasingly similar to that of the euro area.[6] Meanwhile, the United States has seen the most significant growth in high-tech exports.
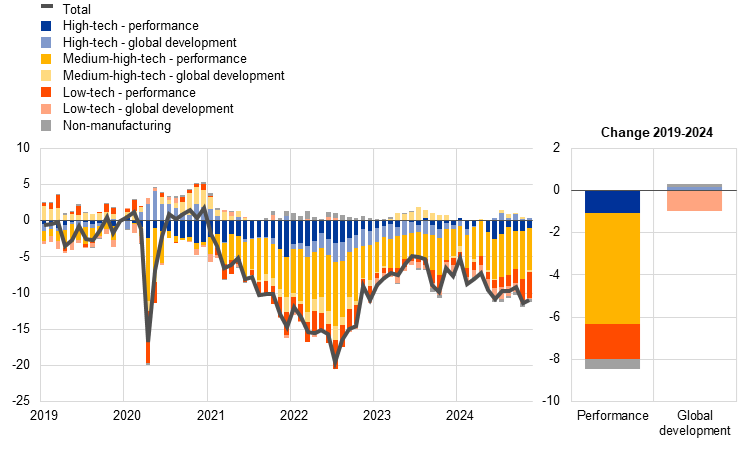
A shift-share analysis highlights that the euro area has lost ground in all manufacturing export sectors, although market share losses in medium-high-tech sectors have been particularly significant. Chart B decomposes developments in aggregate export market shares by sector. For each economy, it distinguishes between two aspects of sector contributions: (i) a “performance” component, which measures changes in the economy’s market share for each sector (the ratio of the economy’s export growth to global import growth in each sector); and (ii) a “global development” component, which measures the global growth of each sector (measured as the ratio of global imports in the sector to total global imports). In other words, this analysis identifies whether changes in an economy’s aggregate share of global export markets reflect gains in market share within particular sectors or the overall global growth of those sectors. While the euro area has lost export market shares in all segments, medium-high-tech sectors have been the main drivers of this trend, being responsible for 55% of the cumulated losses since 2019 (Chart B, panel a). The performance of high-tech sectors has also been relatively weak. In spite of benefiting from strong global demand in high-tech sectors, the euro area has still lost ground relative to other major economies.
Chart B
Sector contributions to developments in export market shares
a) Euro area
(index: December 2019 = 0)
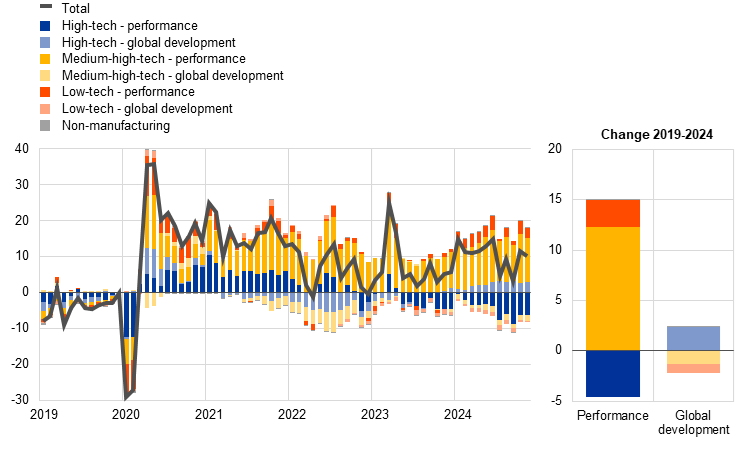
b) China
(index: December 2019 = 0)
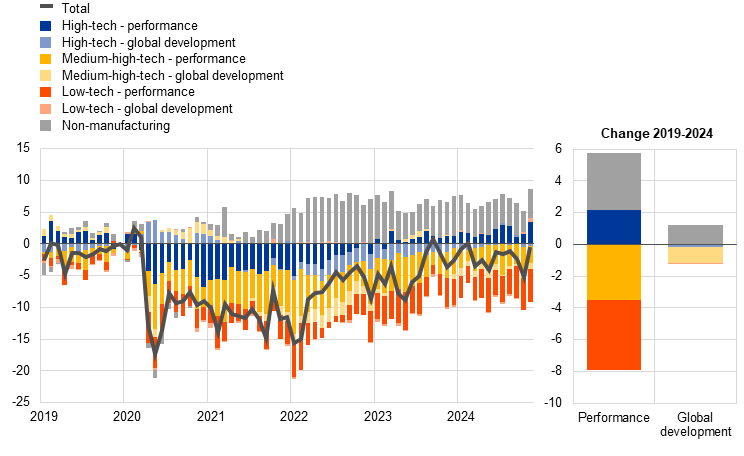
c) United States
(index: December 2019 = 0)
Sources: TDM, CPB Netherlands Bureau for Economic Policy Analysis, Eurostat and ECB staff calculations.
Notes: Seasonally adjusted data. Export market shares are in value terms and for goods only. CPB data are used to calculate aggregate market shares. TDM data are used to calculate sector weights. The latest observations are for November 2024.
China has gained significant export market shares in medium-high-tech sectors, while the United States has expanded its share in high-tech sectors. China’s export performance seems to be almost the inverse of that of the euro area, with strong gains in market share primarily in medium-high-tech sectors (Chart B, panel b). Meanwhile, the United States achieved an almost complete recovery of its export market shares in 2024 compared to 2019, outperforming others in high-tech sectors and non-manufacturing sectors – mainly oil and gas extraction (Chart B, panel c).
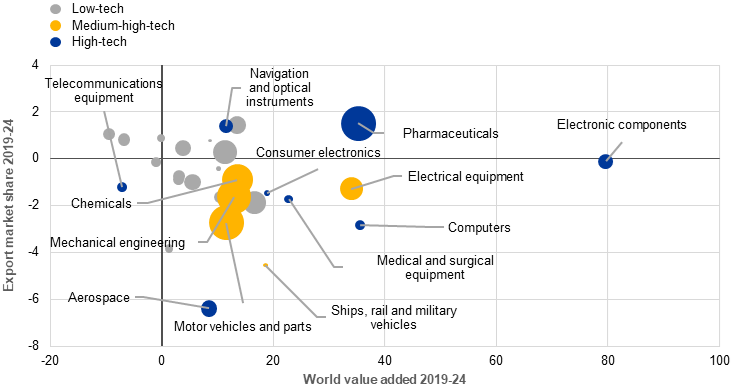
The export performance of the euro area in high-tech sectors is mixed, with notable strengths in pharmaceuticals but significant weaknesses in electronics and computers. On aggregate, high-tech industries have experienced the strongest growth in global value added since 2019 (Chart C). The euro area is a global leader in the pharmaceutical sector, with 36% of global exports, and continued to gain market shares.[7] “Navigation and optical instruments” is another high-tech sector in which the euro area performed well. However, exports in other high-tech sectors were weak, with market shares steadily declining. In the fastest-growing sectors, the euro area lost ground to other major economies, e.g. to China in electronics and to the United States in computers.
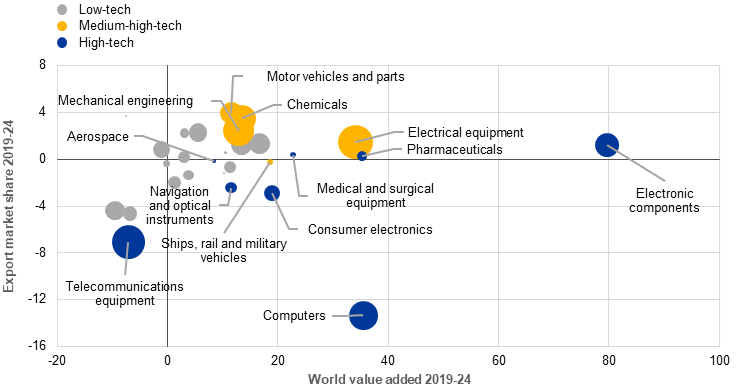
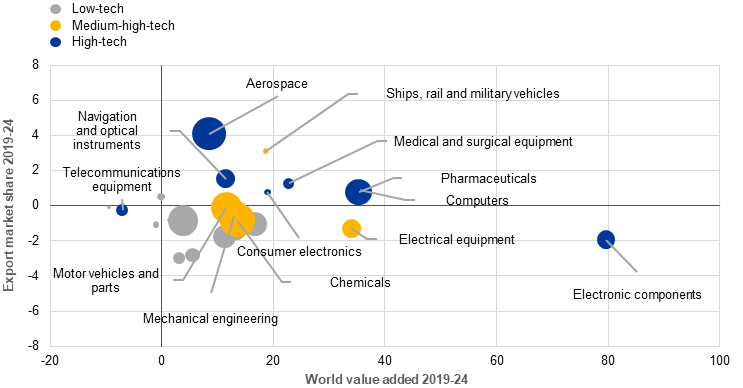
Chart C
Market share growth and world value added growth by sector
a) Euro area
(x-axis: percentage changes; y-axis: percentage point changes)
b) China
(x-axis: percentage changes; y-axis: percentage point changes)
c) United States
(x-axis: percentage changes; y-axis: percentage point changes)
Sources: TDM, Oxford Economics, Eurostat and ECB staff calculations.
Notes: Sector classification follows NACE Rev. 2. The following high-tech and medium-high-tech sectors are included (NACE Rev. 2 divisions/groups in parenthesis): chemicals (20), pharmaceuticals (21), electronic components (26.1), computers (26.2), telecommunications equipment (26.3), consumer electronics (26.4), medical and surgical equipment (26.6), navigation and optical instruments (26.5, 26.7, 26.8), electrical equipment (27), mechanical engineering (28), motor vehicles and parts (29), aerospace (30.3), ships, rail and military vehicles (30 minus 30.3). Technology intensity of sectors follows Eurostat’s “High-tech classification of manufacturing industries”. Bubble sizes reflect the share in the economy’s total nominal exports in 2024. Growth in world value added for the fourth quarter of 2024 is forecast. 2024 data are incomplete for exports and export market shares. The latest observations are for November 2024.
The euro area has lost the most ground to China in medium-high-tech sectors. For the euro area, medium-high-tech exports constitute a large portion of total exports, far exceeding those for high-tech industries. The United States has also lost market shares in this segment, albeit to a smaller extent. China is gaining market shares at the expense of market leaders such as the euro area, especially in the field of electric vehicles, which is strongly benefiting from China’s industrial policies.
Distribution channels: Banking, Finance & Investment Industry
Legal Disclaimer:
EIN Presswire provides this news content "as is" without warranty of any kind. We do not accept any responsibility or liability for the accuracy, content, images, videos, licenses, completeness, legality, or reliability of the information contained in this article. If you have any complaints or copyright issues related to this article, kindly contact the author above.
Submit your press release