(MENAFN- DailyFX) S & P 500/Dow Jones Technical Outlook: S & P 500pulling back from 3000+, top-side t-lineDow Jonesalso coming off a top-side trend-line Continue to watch the Russell 2000 as it lags severely
See how the quarterly forecast has played out what it could mean for the big-picture –Q2 Equity Markets Forecast.
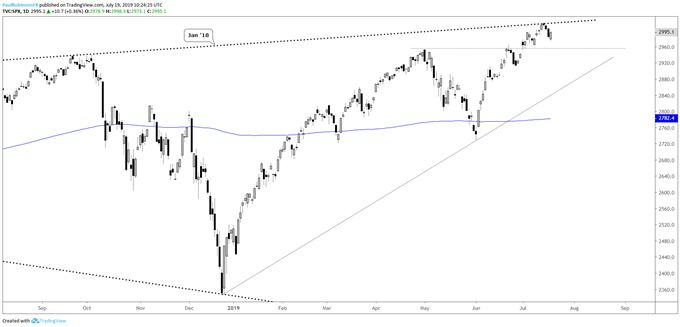
S & P 500 pulling back from 3000+, top-side t-line
The S & P 500 topped 3k last week, notching it for the first time ever. In the process of doing so a top-side trend-line dating back to the January 2018 high was tagged. An interesting confluence of a psychological level and form of resistance.
So far, the response has been relatively benign with only a shallow pullback developing. That could change of course, but as long as the market doesn't fall apart, despite resistance, we will have to respect the generally strong trend.
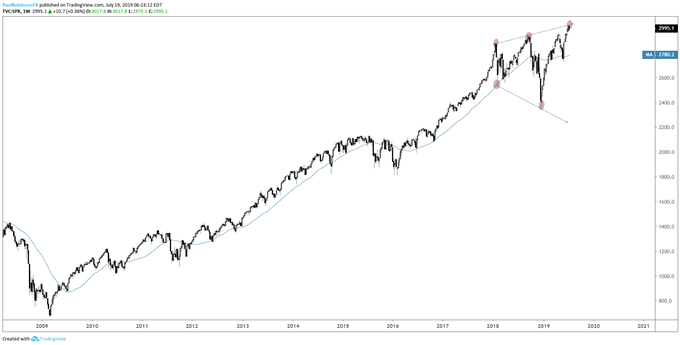
If, however, we see the market start to turn lower with aggression, then it is possible it is the beginning of a decline out of a Reverse Symmetrical Triangle (RST), or known to some as a Megaphone pattern.
These patterns through their increasingly larger price swings indicate growing instability in a trend and can mark major tops; in this case it would be growing uncertainty in a bull market since 2009 that has been one of the most persistent in history. The time from Jan '18 to now is a large span of time for such a topping pattern to develop, which is in good proportion to the extreme bull market run we've seen since the depths of the GFC. It's implications could be quite sizable.
A top and drop could be arriving at an interesting point in time as well given we are heading through the summer towards the fall, a time when stocks have been known to struggle to flat-out get routed.
Check out theIG Client Sentiment pageto see how retail traders are positioned and what it could potentially mean for various currencies and markets moving forward.
S & P 500 Weekly Chart (RST/Megaphone)
S & P 500 Daily Chart (Top-side t-line, 3k area)
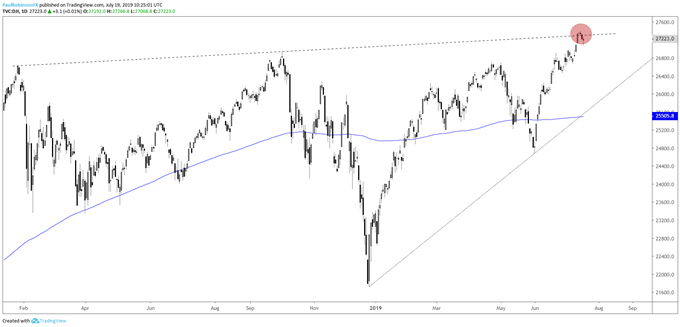
Dow Jones also coming off a top-side trend-line
The Dow Jones is also trading at the trend-line from January 2018. Following the S & P here as it is the broader index, but keep an eye on how the Dow performs relative to it.
Dow Jones Daily Chart (top-side t-line)
Continue to watch the Russell 2000 as it lags severely
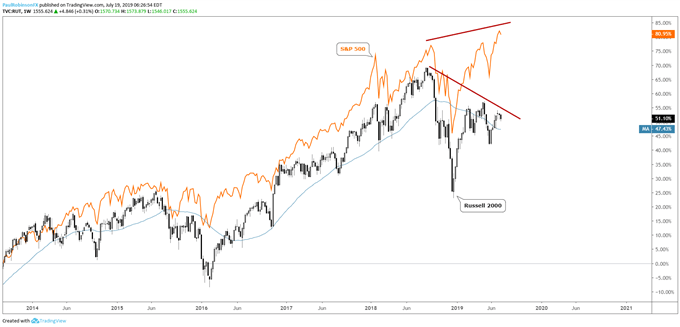
The Russell 2000 is an index I have been discussing with increasing regularity due to the glaring divergence in performance versus large-cap stocks. Small divergences amongst indices are normal and nothing to be alarmed about, but when large-caps (as per the SPX) are trading in record territory and small-caps (as per the R2k) are 12% off their record levels, we could have a problem brewing.
The lack of interest by market participants to pick up higher risk growth stocks is a warning sign of waning risk appetite. With the S & P already building a bearish topping pattern, this further adds to the notion that growing instability may soon come to push the market in reverse. There are other signs too that perhaps the zeal of market participants to own stocks is on the decline; FAANG has lost some interest as it remains below its yearly and record high. (See:GOOG Weighs on FAANG Like FB Did Last Year… )
Russell 2000/S & P 500 Weekly Chart (Major divergence)
To learn more about U.S. indices, check out'The Difference between Dow, Nasdaq, and S & P 500: Major Facts & Opportunities.'You can join me everyWednesday at 10 GMTfor live analysis on equity indices and commodities, and for the remaining roster of live events, check out thewebinar calendar .
Tools for Forex & CFD Traders
Whether you are a beginning or experienced trader, DailyFX has several resources available to help you; indicator for trackingtrader sentiment , quarterlytrading forecasts , analytical and educationalwebinarsheld daily,trading guidesto help you improve trading performance, and one specifically for those who arenew to forex .
---Written by Paul Robinson, Market Analyst
You can follow Paul on Twitter at@PaulRobinsonFX
MENAFN2007201900760000ID1098779855
Legal Disclaimer:
MENAFN provides the information “as is” without warranty of any kind. We do not accept any responsibility or liability for the accuracy, content, images, videos, licenses, completeness, legality, or reliability of the information contained in this article. If you have any complaints or copyright issues related to this article, kindly contact the provider above.